.png)
The Backchannel
What's a Good Win Rate? SaaS Sales Benchmarks You Can Actually Use
Featured Blog


The Most Misunderstood Number in Sales
Win rate is one of the most cited metrics in B2B sales and one of the most misunderstood. Leaders quote it in board meetings, reps compare theirs to colleagues', and everyone has an intuition about what a "good" win rate is usually a number they heard somewhere and never examined. The trouble is that win rate is far more slippery than it appears. The same sales team can report wildly different win rates depending on how the metric is calculated, and two companies reporting identical win rates can have completely different sales operations underneath. A number this easy to misread is dangerous precisely because everyone assumes they understand it.
The core problem is that "win rate" isn't a single, standardized metric. It's a family of related calculations that share a name but measure different things. One company calculates win rate as deals won divided by all deals created. Another calculates it as deals won divided by deals that reached a qualified stage. Another uses deals won divided by deals that reached a final decision, excluding everything that fizzled earlier. These produce dramatically different numbers from the exact same underlying sales activity, which means that comparing your win rate to a benchmark or to another team's without knowing how each was calculated is comparing things that aren't comparable.
This post is about understanding win rate well enough to use it properly: what the different calculations actually measure, what constitutes a healthy win rate given how you define it and what you sell, why the raw number matters less than most people think, and how to use win rate as a diagnostic tool rather than just a scorecard. The goal is to turn a number that's usually quoted without understanding into one you can actually reason about and act on.
Why "Win Rate" Means Different Things
Before any benchmark is useful, you have to be precise about what's in the denominator, because the denominator is where all the ambiguity lives. The numerator is usually clear deals won. It's what you divide that by that determines what the number means.
A useful way to see why the denominator matters so much is to imagine two sales teams with identical underlying performance they pursue the same deals, win the same ones, lose the same ones. If one team creates an opportunity record for every early conversation and the other only creates one after qualification, their reported win rates will differ by a factor of two or three, despite the selling being identical. The number diverges not because of anything real about how well they sell, but purely because of a bookkeeping choice about when an opportunity gets logged. This is the heart of why cross-company win-rate comparison is so treacherous: you're often comparing bookkeeping conventions rather than sales effectiveness, and no benchmark can correct for that unless it specifies exactly how it was calculated.
The broadest definition divides wins by every opportunity ever created, including the ones that were never really qualified, the ones that disappeared after a single call, and the ones that were created optimistically and went nowhere. This produces the lowest win-rate number, and it measures something closer to overall funnel efficiency than to selling effectiveness, because it includes a lot of opportunities that were never genuinely winnable in the first place. A low number here isn't necessarily bad it may just reflect a team that creates opportunities liberally and qualifies them later.
A narrower definition divides wins by opportunities that reached a qualified stage deals where there was a confirmed need, budget, and genuine evaluation. This produces a higher number and measures something closer to true selling effectiveness, because it excludes the unqualified noise and focuses on deals that were real contests. This is usually the more useful definition for assessing how well a team actually sells, because it isolates the deals where selling skill could plausibly have affected the outcome.
The narrowest common definition divides wins by deals that reached a final decision won plus lost, excluding everything that stalled or disappeared without a clear verdict. This produces the highest number and measures your competitiveness in deals that went the distance. It's useful for understanding how you fare head-to-head once a buyer is genuinely deciding, but it can flatter a team by hiding all the deals that quietly died before reaching a decision, which are often where the real problems live.
The decision-stage definition has a particular blind spot worth dwelling on, because it's the one most likely to create false confidence. A team can post an impressive win rate on deals that reach a decision while a huge share of its pipeline never reaches a decision at all deals that stall indefinitely, go dark, or get endlessly pushed without ever being formally lost. Those stalled deals don't count against the decision-stage win rate, so the number looks healthy even though the team is hemorrhaging value into a graveyard of deals that never resolve. The "no decision" outcome is often the single largest category of lost opportunity in B2B sales, and the decision-stage win rate is specifically constructed to ignore it. This is why that definition, while useful for measuring head-to-head competitiveness, should never be used alone it hides exactly the problem that most needs attention.
None of these is the "correct" definition. They each measure something legitimate and different. The point is that you cannot interpret a win rate, your own or anyone else's, without knowing which denominator produced it. A 20% win rate on all opportunities created and a 60% win rate on deals that reached a decision could describe the exact same team, and treating either number as comparable to a benchmark calculated differently is simply an error.
What Healthy Win Rates Look Like
With the caveat that the calculation method changes everything, here is roughly what healthy win rates tend to look like across the common definitions useful as orientation, provided you match the definition to the number.
On the broadest definition wins over all opportunities created healthy performance often lands in the range of roughly 15% to 30%, depending heavily on how liberally the team creates opportunities. A team that creates an opportunity for every flicker of interest will land lower on this measure without being any worse at selling; a team that only creates opportunities after some qualification will land higher. Because this number is so sensitive to opportunity-creation discipline, it's the least comparable across companies, and reading too much into it relative to a benchmark is risky.
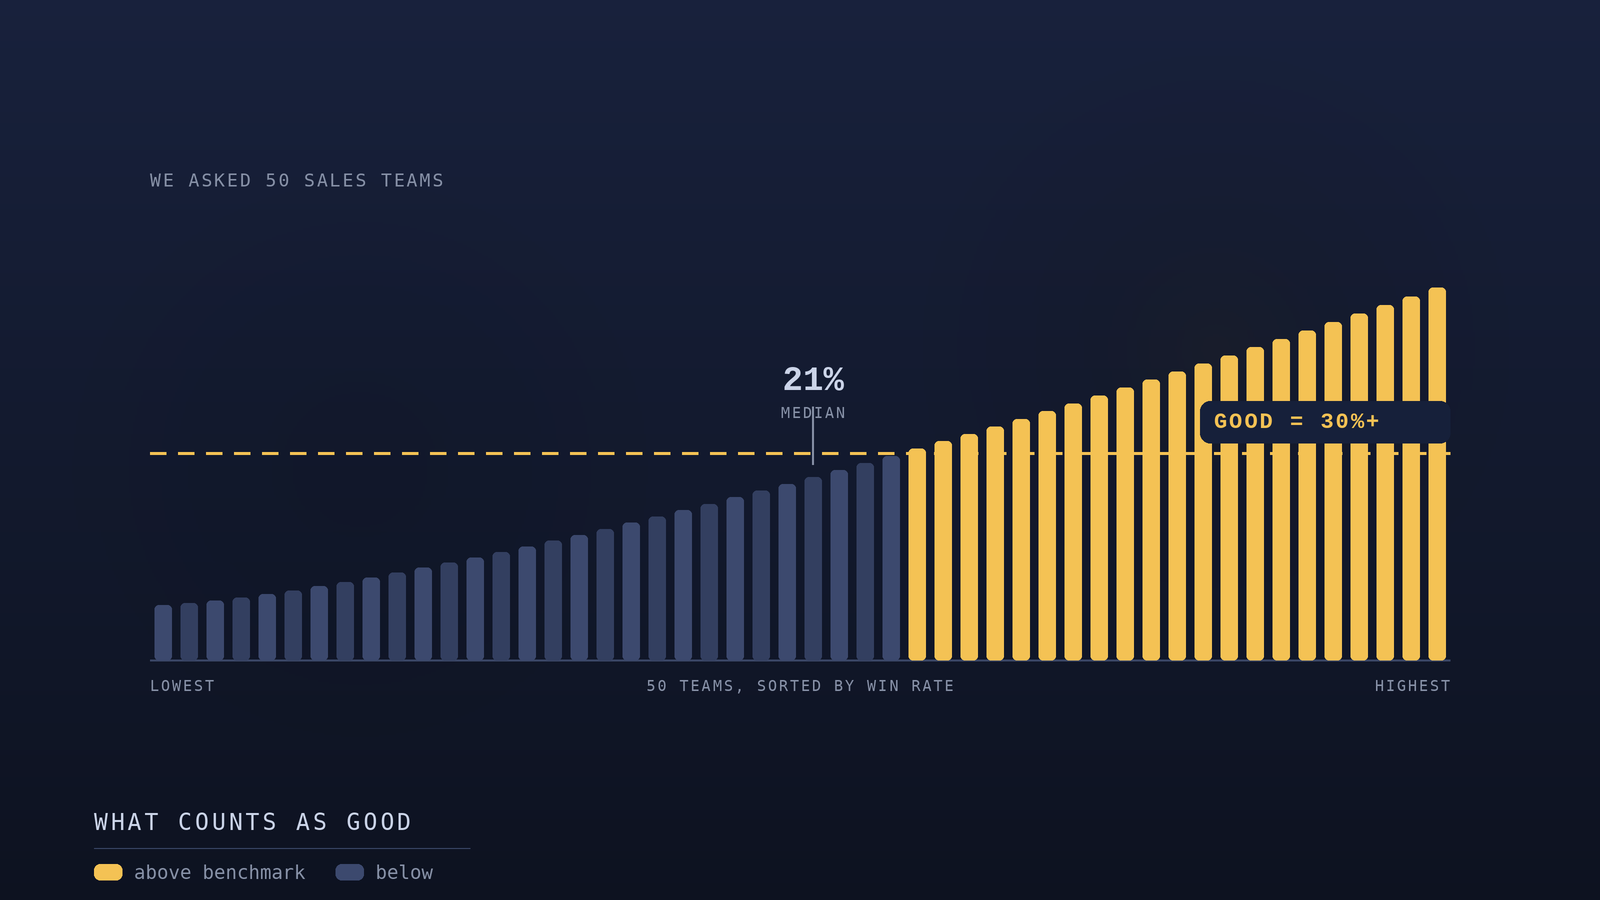
On the qualified-opportunity definition wins over deals that reached a genuine qualified stage healthy performance often lands in the range of roughly 25% to 40%. This is usually the most meaningful range for assessing selling effectiveness, because it captures deals that were real contests. A win rate well below this range on qualified opportunities suggests a genuine selling or fit problem; a win rate well above it suggests either strong selling, strong product-market fit, or possibly over-qualification that's screening out winnable deals before they're counted.
On the reached-a-decision definition wins over won-plus-lost healthy performance is naturally higher, often in the range of roughly 40% to 60% or more. But this number must be read alongside how many deals never reached a decision at all, because a high decision-stage win rate paired with a large population of stalled deals can mask a serious problem: the team may be winning the deals that reach a verdict while losing enormous value to deals that simply never get there.
These ranges are starting points, not targets. Where a healthy team lands within or relative to them depends on deal size, market, competitive intensity, and sales motion. A self-serve product and an enterprise platform will have different healthy win rates for structural reasons, just as they have different healthy sales cycles. The ranges are useful only when matched to both the calculation method and the business context.
Why the Raw Number Matters Less Than You Think
Here's the part that surprises people: the absolute win-rate number is far less important than most leaders treat it. Obsessing over hitting a particular win-rate figure is usually a mistake, because the number in isolation tells you very little about whether your sales operation is healthy.
Consider that win rate can be trivially manipulated by changing qualification strictness. A team that wants a higher win rate can simply qualify more aggressively only creating or advancing opportunities that are very likely to close. This raises the win rate while potentially shrinking total pipeline and revenue, because deals that were winnable but uncertain get screened out before they count. A higher win rate achieved this way is not an improvement; it's often a step backward disguised as progress. Conversely, a team that lowers its win rate by pursuing more ambitious, less certain deals might be generating more total revenue even as the percentage drops. The win rate moved in the "wrong" direction while the business got better.
There's a particularly insidious version of this manipulation that's worth naming, because it often happens unintentionally. When a team is under pressure to improve its win rate, individual reps start quietly declining to pursue deals they're not confident about not through any explicit policy, but because their incentives now reward a clean win rate over total revenue. Over time this risk-aversion compounds: the team stops competing for exactly the ambitious, uncertain deals that, while harder to win, represent the largest revenue opportunities. The win rate climbs, everyone feels good about the trend, and revenue growth quietly stalls because the team has optimized itself into only chasing safe deals. This is why making win rate a target rather than a diagnostic can actively damage a business, even as the metric appears to improve.
This is why win rate must always be read alongside volume and revenue, never in isolation. The question is never simply "is our win rate high?" It's "are we generating maximum revenue given our resources?" and win rate is only one input into answering that. A 25% win rate on a large volume of ambitious deals can produce far more revenue than a 50% win rate on a small volume of safe ones. The team with the lower win rate is winning, in the only sense that ultimately matters, which is revenue generated.
The deeper point is that win rate is a ratio, and ratios hide the absolute quantities underneath them. Optimizing a ratio without watching the absolute numbers is one of the most common ways teams fool themselves into thinking they're improving when they're actually shrinking. The healthiest way to hold win rate is as one diagnostic among several, never as a target to maximize on its own.
Win Rate as a Diagnostic Tool
The real value of win rate isn't as a scorecard it's as a diagnostic. When you segment win rate and watch how it moves, it reveals things about your sales operation that the aggregate number conceals, and these revelations are where the metric earns its keep.
Segmenting win rate by source shows you which lead sources produce deals you actually close. A source that generates a high volume of opportunities but a low win rate is producing low-quality pipeline, even if it looks productive on a volume basis. A source with a high win rate is producing well-qualified pipeline worth investing more in. The aggregate win rate hides this entirely; the segmented view makes it actionable, often redirecting marketing and prospecting investment toward the sources that actually convert.
Segmenting win rate by deal size shows you where your sales motion is genuinely competitive and where it's struggling. Many teams discover that their win rate is strong in one size band and weak in another winning consistently in mid-market but losing in enterprise, or vice versa. That pattern is a strategic signal: it tells you where your product, pricing, and sales motion actually fit, and where you're spending effort on deals you're structurally unlikely to win. Acting on it can mean focusing on the band where you win and either fixing or avoiding the one where you don't.
Segmenting win rate by competitor shows you who actually beats you and who you beat. A consistently low win rate against a specific competitor is a signal worth deep investigation it suggests a real gap in product, positioning, or sales approach against that competitor that's costing you deals you might otherwise win. A high win rate against another competitor tells you where your advantages are real and worth leaning into during competitive deals.
The competitor segmentation deserves special emphasis because it often surfaces the highest-leverage fix available to a sales team. When you discover that you lose seventy percent of the deals where a particular competitor is present, you've found something far more actionable than an aggregate win rate could ever give you. That single finding points directly at work worth doing: understanding what that competitor offers that you don't, how they position against you, where they beat you on price or features or trust, and what you'd need to change to compete. A few percentage points of improvement against a competitor you frequently face can be worth more than a broad, unfocused effort to lift the overall number, precisely because it targets a specific, recurring loss pattern rather than spreading effort thin across every deal.
Watching win rate as a trend over time is the most important diagnostic of all. A win rate that's declining over time is an early warning that something is degrading fit, competitiveness, lead quality, sales execution and catching that decline early lets you investigate before it shows up as a missed number. A win rate that's improving confirms that changes you've made are working. The trend, segmented thoughtfully, turns win rate from a static report card into a living instrument that tells you where your sales operation is getting better and where it's getting worse.
How to Actually Use Win Rate
Pulling this together, the productive way to use win rate looks quite different from how most teams use it. Most teams quote a single aggregate number and compare it anxiously to a benchmark they half-remember. The productive approach is more disciplined and far more useful.
Start by defining your calculation explicitly and using it consistently. Pick the denominator that best matches what you want to measure usually the qualified-opportunity definition for assessing selling effectiveness and apply it the same way every time, so your numbers are comparable to themselves across periods. Consistency with yourself matters far more than alignment with any external benchmark, because the trend in your own consistently-measured number is the signal you can actually act on.
Then use win rate as a diagnostic, not a target. Segment it by source, deal size, and competitor, and watch how it moves over time. Let it tell you where your pipeline quality is high and low, where your sales motion fits and doesn't, and who beats you and who you beat. These segmented insights are where the metric creates value, because each one points to a specific action you can take to improve the business.
And always read win rate alongside volume and revenue, never alone. The goal is maximum revenue given your resources, and win rate is one input into that goal, not the goal itself. A change in win rate is only good or bad in the context of what happened to total revenue. Held this way defined consistently, segmented diagnostically, and interpreted alongside the absolute numbers win rate becomes one of the more useful instruments in a sales operation. Held the other way, as a single number to be maximized and compared to a half-remembered benchmark, it's as likely to mislead as to inform. The number was never the point; what it reveals when you interrogate it properly is where the value lives.
TRY BACKCHANNELS FREE
Your next customers are already in the database.
Backchannels gives you 225,000 verified software decision-makers. Filter to your exact ICP, preview matches for free, and push them straight into Salesforce or HubSpot. Pay per contact. No subscription, no contract.
Browse contacts freeNo credit card. Preview before you spend a credit.
No items found.
Final Thoughts
'Win rate' means different things depending on the denominator, and the raw number matters less than the trend. Define it consistently, segment it diagnostically, and always read it alongside revenue.
Published
August 14, 2026
Writer
Joe Backchannels
Share


Most Wanted


12 min read

12 min read

June 2026