.png)
The Backchannel
We Analyzed 200 SaaS Sales Cycles Here's What Good Looks Like
Featured Blog

The Question Every Sales Leader Eventually Asks
At some point, every B2B SaaS sales leader asks a version of the same question: is our sales cycle normal? When a deal takes four months to close, is that a problem with the deal, a problem with the rep, or just how long deals in our category take? When the team complains that cycles are getting longer, is that a real trend worth worrying about or just the normal noise of a few large deals? Without a benchmark, these questions are unanswerable, and leaders end up making decisions based on gut feel about what a sales cycle "should" look like rather than any actual evidence.
The trouble is that most published sales-cycle benchmarks are nearly useless, because they aggregate across companies so different from each other that the average means nothing. A benchmark that blends a self-serve product selling to small businesses with an enterprise platform selling six-figure deals to Fortune 500 procurement departments produces a number that describes neither. The "average B2B sales cycle" is a statistic with almost no practical value, because the variance between segments is so much larger than any central tendency.
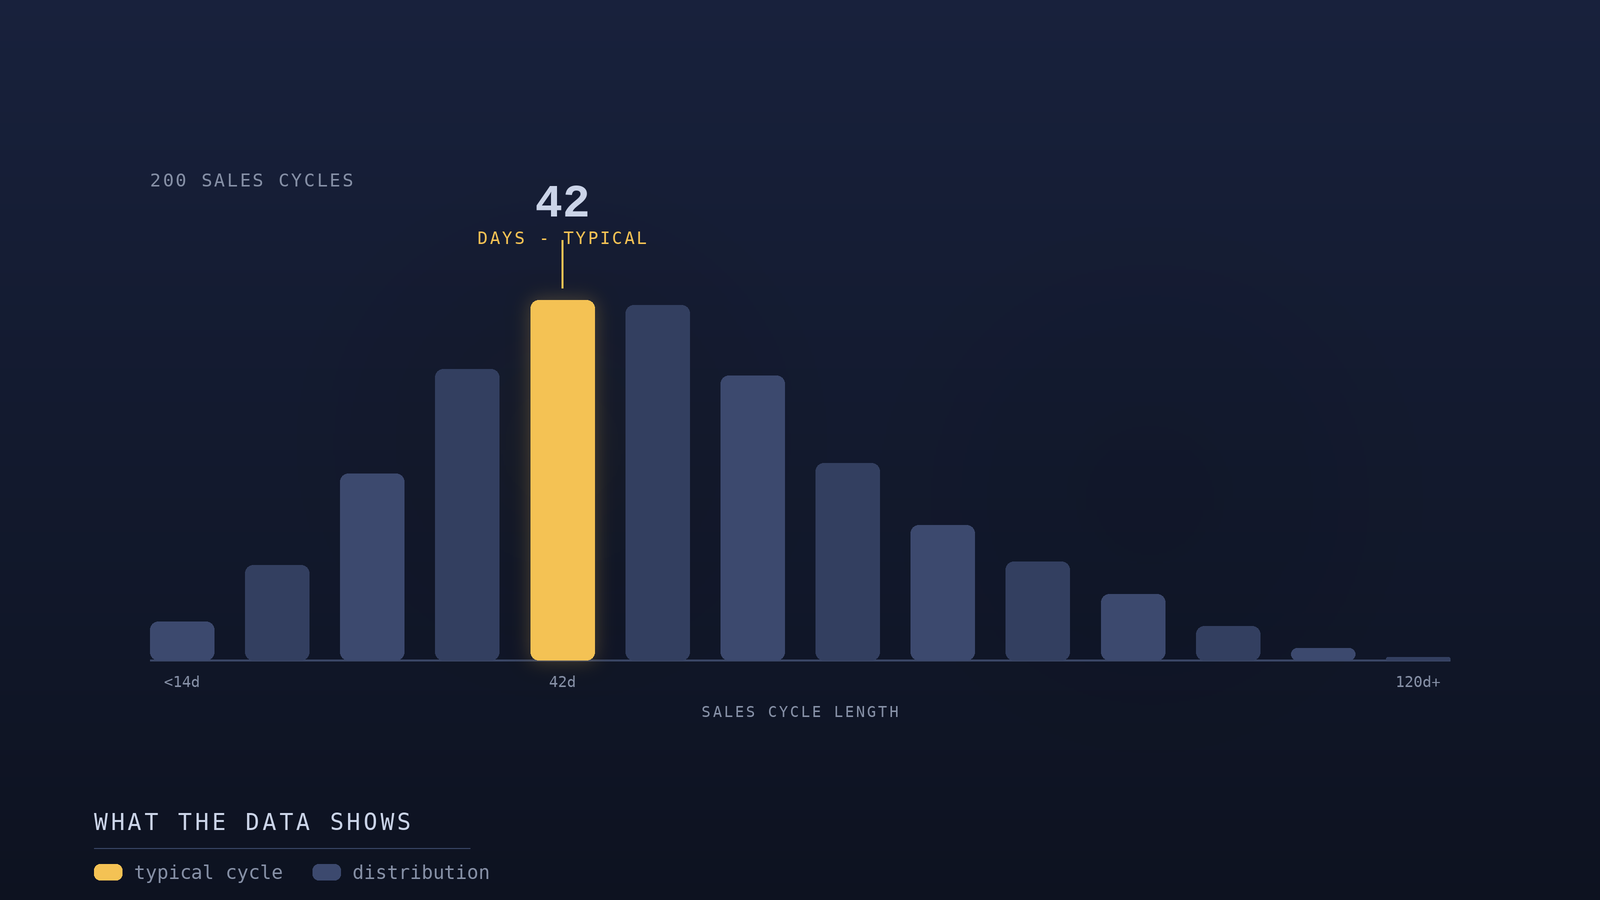
So we did the analysis ourselves, in a way designed to be actually useful: we looked at 200 SaaS sales cycles, segmented carefully by deal size and buyer type, to understand not just the average but the shape of what good looks like in each segment. This post shares what we found the benchmarks themselves, the factors that drive the variation, and how to use this information to assess and improve your own sales cycle. The goal isn't to give you a single number to compare against, but to give you a framework for understanding where your cycle should land given what and to whom you're selling.
Why "Average Sales Cycle" Is a Misleading Number
Before sharing the benchmarks, it's important to understand why segmentation matters so much, because using an unsegmented benchmark is worse than using none at all it gives you false confidence in a comparison that doesn't apply to you.
Sales cycle length is driven primarily by the structure of the purchase, not by the efficiency of the sales team. A small deal sold to a single decision-maker who can swipe a credit card closes in days or weeks because there's one person, one budget, and one decision. A large deal sold to an enterprise with a procurement process, a security review, multiple stakeholders, and a legal department takes months because the purchase structurally requires many people to align, each of whom adds time. These two cycles aren't different because one team is better than the other. They're different because the purchases are fundamentally different transactions.
It helps to think of the sales cycle not as a single duration but as the sum of several waiting periods, most of which are outside the seller's direct control. There is the time the buyer spends deciding internally that the problem is worth solving. There is the time spent evaluating options. There is the time spent securing budget. There is the time spent on procurement, legal, and security. And there is the time spent on the buyer's own internal scheduling and coordination. The seller influences some of these, but many are governed entirely by the buyer's organization. This is why two equally skilled reps selling the same product can have very different cycle lengths depending on which buyers they happen to be working the cycle is a property of the buyer's structure as much as the seller's skill.
This means that comparing your sales cycle against an unsegmented average tells you almost nothing useful. If you sell mostly mid-market deals and the benchmark blends in self-serve and enterprise, the benchmark could make you feel slow when you're actually fast for your segment, or fast when you're actually slow. The only benchmark worth comparing against is one that matches your specific combination of deal size and buyer type. That's why the numbers below are segmented, and why you should locate yourself in the right segment before drawing any conclusions about your own performance.
There's a second reason segmentation matters that's easy to overlook: a company's own segment mix can shift over time, which makes its blended average sales cycle move even when nothing about its execution has changed. A team that starts closing more enterprise deals will see its average cycle lengthen not because it got slower, but because its mix shifted toward structurally longer deals. Without segmentation, this looks like a performance regression and triggers the wrong response. With segmentation, it's correctly understood as a healthy move upmarket. Tracking cycle length by segment rather than in aggregate protects you from misreading a change in deal mix as a change in sales effectiveness.
What We Found: Benchmarks by Segment
Across the 200 sales cycles we analyzed, clear patterns emerged when we segmented by deal size and buyer type. The numbers below describe the typical range for healthy deals in each segment not the fastest possible, but what a well-run sales motion tends to produce.
In the smallest segment self-serve and low-touch deals under roughly $5,000 in annual contract value, sold to individuals or small teams who can make their own purchasing decisions healthy cycles ran from a few days to about three weeks. These deals are fast because the buyer is the decision-maker, the price is low enough not to require approval, and the value is usually self-evident enough not to require extensive evaluation. When these cycles stretch longer, it's usually a sign of friction in the product experience or unnecessary human involvement slowing down what should be a self-directed purchase.
In the SMB segment deals roughly $5,000 to $15,000 in ACV sold to small businesses healthy cycles ran from about three weeks to two months. There's typically a single decision-maker or a very small buying group, but the deal size is large enough to warrant some evaluation and perhaps a budget conversation. The cycle is longer than self-serve because there's a real sales process, but it's still compressed because the buying group is small and the approval chain is short.
In the mid-market segment deals roughly $15,000 to $50,000 in ACV sold to companies with more formal processes healthy cycles ran from about two to four months. This is where multiple stakeholders typically enter the picture: an economic buyer, a champion, a technical evaluator, and often a procurement or finance touchpoint. Each additional stakeholder adds time, because each needs to be informed, convinced, and aligned. The cycle lengthens not because the selling is worse but because the buying is structurally more complex.
In the enterprise segment deals above roughly $50,000 in ACV sold to large organizations healthy cycles ran from about four months to a year or more. These deals involve the full apparatus of enterprise procurement: multiple decision-makers across functions, formal security and compliance reviews, legal negotiation of contract terms, and often a pilot or proof-of-concept phase. The length is a structural feature of selling to large organizations, not a sign of a slow sales process, and trying to force these deals to close faster than the buyer's process allows usually backfires.
What Actually Drives the Variation
The segment benchmarks above are driven by a handful of underlying factors. Understanding these factors is more useful than memorizing the numbers, because they let you reason about where your own cycle should land and what's actually moving it.
The first and most powerful driver is the number of stakeholders involved in the decision. This single factor explains more sales-cycle variation than anything else. Every additional person who must be convinced and aligned adds time not linearly, but often more than linearly, because stakeholders have to coordinate with each other, schedules have to align, and any one of them can stall the deal by being unavailable or unconvinced. A deal with one decision-maker and a deal with six decision-makers are different animals, and the stakeholder count predicts the cycle length better than the deal size does in most cases.
The stakeholder-count driver also explains a phenomenon that frustrates many sales teams: why a deal that seemed to be moving quickly suddenly stalls. Often what happened is that a new stakeholder entered the decision late a security lead, a finance approver, an executive who hadn't been involved and that new person effectively resets part of the evaluation, because they need to be brought up to speed and convinced from scratch. The deal didn't slow down because the buyer lost interest; it slowed down because the buying group expanded. This is why multi-threading early, deliberately identifying and engaging all the stakeholders who will eventually need to weigh in, is one of the most effective ways to keep a cycle within its expected range. The stakeholders who derail timelines are usually the ones who showed up late, and they showed up late because no one engaged them early.
The second driver is the presence and rigor of a formal procurement process. Once a purchase is large enough to trigger formal procurement, the cycle extends substantially regardless of how enthusiastic the buyer is. Procurement adds steps vendor reviews, competitive bids, approval workflows that take time by design, because their purpose is to introduce deliberation and scrutiny into large purchases. A deal can be fully sold from the buyer's perspective and still take months to close because it has to traverse a procurement process that operates on its own timeline.
The third driver is the need for security and compliance review. For deals involving sensitive data or regulated industries, security review can add weeks or months independent of everything else. These reviews are conducted by teams separate from the buyer, on their own schedules, with their own requirements, and the deal cannot close until they sign off. A product's security posture and its readiness to satisfy these reviews quickly can materially affect cycle length in segments where these reviews are standard.
The fourth driver is the complexity of the value proposition and the corresponding need for evaluation. A product whose value is immediately obvious closes faster than one that requires a pilot, a proof of concept, or extensive evaluation to demonstrate its worth. The more a buyer needs to see the product prove itself in their specific environment before committing, the longer the cycle, because the evaluation itself takes time and the buyer won't commit until it's complete.
Each of these four drivers also suggests a corresponding lever for keeping cycles healthy. The stakeholder driver argues for multi-threading early. The procurement driver argues for understanding the buyer's procurement process upfront and preparing for it rather than being surprised by it. The security-review driver argues for initiating those reviews as early as the buyer will allow rather than waiting until the end. And the evaluation-complexity driver argues for demonstrating value as efficiently and concretely as possible, so the buyer reaches conviction faster. None of these levers shortens the structural minimum of a given segment, but each one prevents a deal from running longer than it has to which, in practice, is where most of the controllable cycle time actually lives.
How to Use These Benchmarks
The point of these benchmarks isn't to give you a target to hit it's to give you a frame for assessing your own sales cycle honestly and identifying where there's genuine room to improve versus where the length is structural and unavoidable.
Start by locating yourself in the right segment. Identify which segment most of your deals actually fall into based on deal size and buyer type, and compare your cycle against that segment's range rather than against an overall average. If your cycle falls within the healthy range for your segment, the length is probably structural, and efforts to compress it further may yield little or may even backfire by pressuring buyers in ways that damage deals. If your cycle is meaningfully longer than the healthy range for your segment, that's a signal worth investigating, because it suggests there's friction in your process beyond what the structure of the purchase requires.
When your cycle is longer than the benchmark for your segment, the underlying drivers point to where to look. Are deals stalling because too many stakeholders are getting involved late, when earlier multi-threading would have surfaced them sooner? Are deals waiting on security reviews that could have been initiated earlier in the process? Is the evaluation phase dragging because the product's value isn't being demonstrated efficiently? Each of these is addressable, and the benchmark is what tells you there's something to address rather than just accepting a long cycle as inevitable.
It's equally important to recognize when a cycle is as short as it's going to get. A team selling enterprise deals that tries to force them into a mid-market timeline will frustrate buyers and lose deals by pushing harder than the buyer's process can accommodate. Knowing that your four-to-twelve-month enterprise cycle is structurally normal frees you to stop fighting it and instead focus on running a great process within that timeline multi-threading early, initiating reviews promptly, keeping momentum across the inherent length rather than trying to eliminate it.
The Metric That Matters More Than Average Length
While average cycle length is the headline number, the more actionable metric we found in our analysis is cycle-length consistency how much variation there is between your deals within a segment. A team whose mid-market deals all close in roughly three months is in a fundamentally healthier position than a team whose mid-market deals range wildly from one month to eight, even if both have the same average.
Consistency matters because it indicates a repeatable process. When deals in the same segment close in a predictable timeframe, it means the sales motion is working the same way each time the same steps, the same stakeholder engagement, the same progression. That repeatability is what makes a sales motion scalable and forecastable. You can predict when deals will close, plan capacity accordingly, and trust your pipeline math.
Wide variation within a segment, by contrast, signals an inconsistent process. Some deals are being run well and closing on time while others are drifting, stalling, or being handled differently. That inconsistency makes forecasting unreliable and suggests that the difference between fast and slow deals is something within your control rep skill, process discipline, stakeholder management rather than something structural about the deals themselves. Tightening that variation, by understanding why some deals close quickly and others don't and bringing the slow ones closer to the fast ones, is often a higher-return effort than trying to reduce the average cycle length across the board.
So when you assess your own sales cycle against these benchmarks, look at the spread as much as the average. A consistent cycle that's slightly longer than the benchmark is usually healthier than an inconsistent one that averages out to the benchmark, because the consistent one reflects a process you can trust and improve systematically. The average tells you where you stand; the consistency tells you whether you have a repeatable machine or a collection of deals that happen to be working out, and the latter distinction is what actually determines whether your sales motion will scale.
TRY BACKCHANNELS FREE
Your next customers are already in the database.
Backchannels gives you 225,000 verified software decision-makers. Filter to your exact ICP, preview matches for free, and push them straight into Salesforce or HubSpot. Pay per contact. No subscription, no contract.
Browse contacts freeNo credit card. Preview before you spend a credit.
No items found.
Final Thoughts
There is no single 'normal' sales cycle only normal for your segment. Find your segment, judge your cycle against it, and watch consistency as closely as average length.
Published
August 14, 2026
Writer
Joe Backchannels
Share


Most Wanted

12 min read

12 min read

June 2026