.png)
The Backchannel
The 5 Salesforce Reports Every AE Should Have Bookmarked
Featured Blog


The Difference Between Reps Who Know Their Pipeline and Reps Who Don't
There's a visible difference between account executives who have command of their pipeline and those who are perpetually surprised by it. The first group always seems to know which deals are progressing, which are stalling, which need attention today, and which can wait. The second group operates reactively, discovering problems when it's already too late to fix them a deal that slipped because a follow-up was missed, a quarter that came up short because the math never added up in the first place, a forecast that was wrong because it was based on optimism rather than evidence.
The difference between these two groups is rarely talent or effort. It's information. The reps who have command of their pipeline have built the habit of looking at the right data, in the right format, at the right cadence. They're not working harder than their peers they're working from a clearer picture, and that clearer picture lets them direct their effort where it matters most instead of spreading it evenly across deals that deserve very different levels of attention.
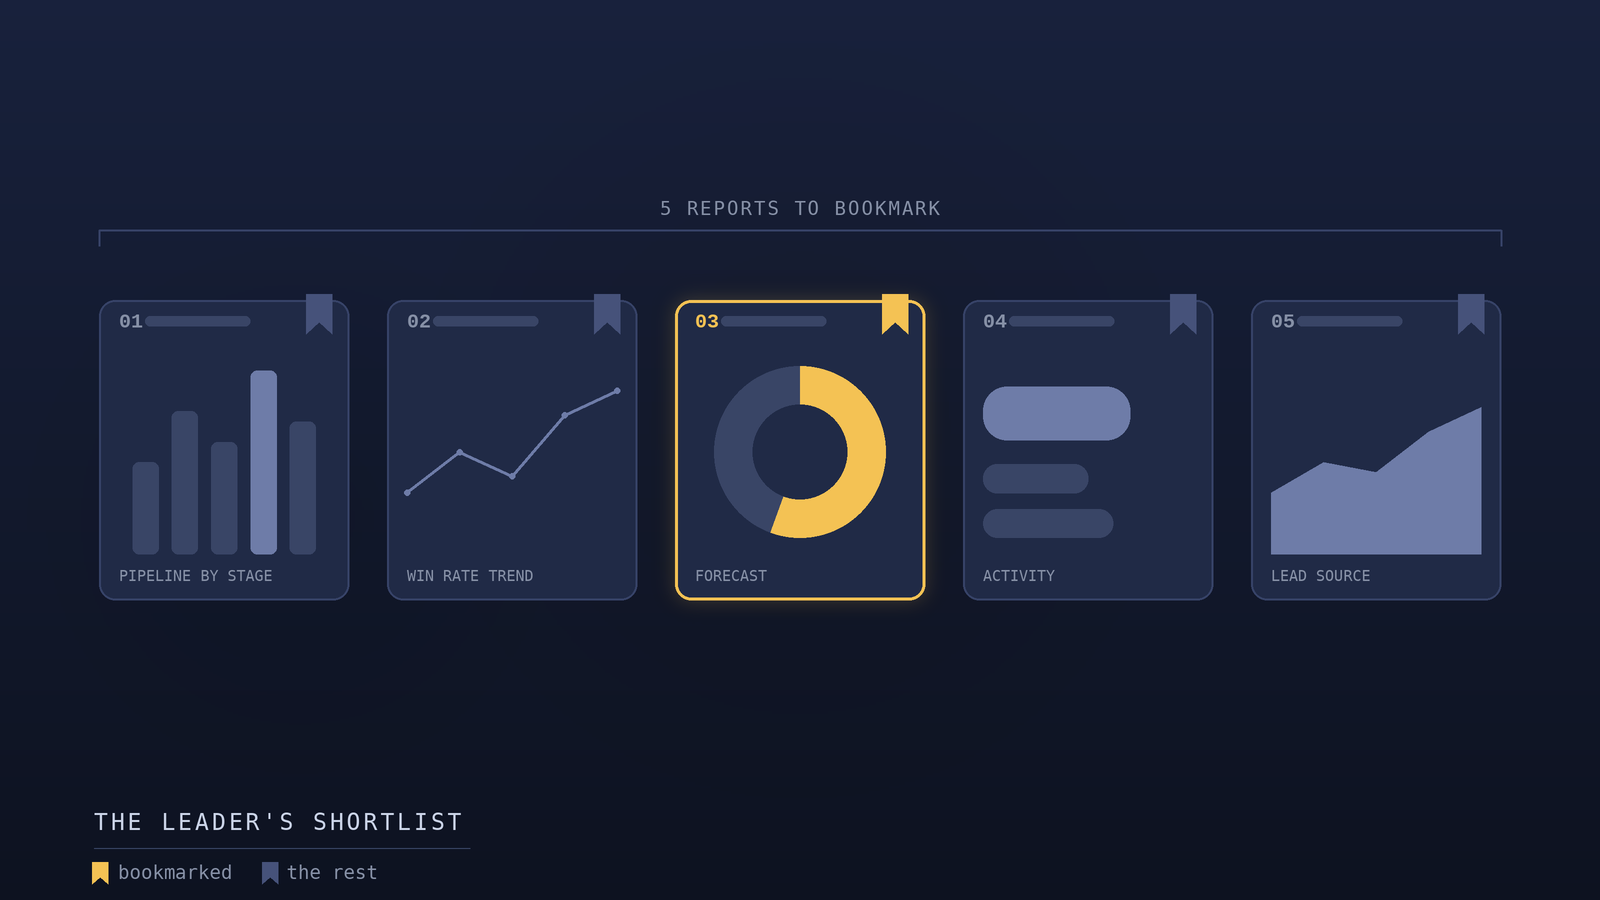
Salesforce contains all the information an AE needs to operate this way. The problem is that the default Salesforce experience buries that information under complexity, and most reps never build the specific reports that would surface what they actually need to see. This post is about the five reports that, in our experience, most directly separate reps who command their pipeline from those who are managed by it. Build these five, bookmark them, and check them on a regular cadence, and you'll find yourself operating proactively instead of reactively which is the whole game in quota-carrying sales.
Why the Default Salesforce View Fails AEs
Before getting to the reports, it's worth understanding why the out-of-the-box Salesforce experience leaves most reps under-informed. Salesforce is built to be everything to everyone a platform that serves sales, marketing, service, and operations across companies of wildly different sizes and structures. That generality is its strength as a platform and its weakness for an individual rep, because the default views are designed for no one in particular and therefore serve no one especially well.
The standard opportunity list view shows you your deals, but it doesn't tell you which ones need attention. It's a flat list, sorted by whatever field you last clicked, with no inherent sense of priority. A rep looking at that list has to mentally process every deal to figure out where to focus, which is cognitively expensive and easy to get wrong. The information needed to prioritize is technically present close dates, stages, last activity, amounts but it's not organized in a way that makes the priorities obvious.
The reports below solve this by doing the organizing work in advance. Instead of presenting a flat list and asking the rep to figure out what matters, each report is built around a specific question an AE needs answered regularly, and it surfaces exactly the deals relevant to that question. The reports turn Salesforce from a database you have to interrogate into a set of answers you can simply read. That shift from interrogation to answers is what makes the difference in daily practice.
A useful way to think about why these five reports in particular is that each one targets a different time horizon of your business, and together they give you complete temporal coverage. The no-activity report protects deals in the present. The closing-this-month report manages the immediate future. The pipeline-created report secures the medium-term future two and three months out. The slippage report corrects the distortions that creep into your view of the future. And the won-and-lost report mines the past for lessons that improve everything going forward. Most reps monitor only the present and the immediate future the deals in front of them and the ones closing soon which leaves them blind to the pipeline-creation shortfalls and slippage patterns that determine whether future quarters succeed. The five-report system covers every horizon at once, which is why it produces consistency rather than the feast-and-famine cycle that comes from only watching what is closing right now.
Report 1: Deals With No Activity in 14 Days
The single most valuable report an AE can build is the one that surfaces open opportunities with no logged activity in the past two weeks. This report answers the most important question in pipeline management: which of my deals are quietly dying from neglect?
Deals don't usually die from a dramatic loss to a competitor or a definitive rejection. They die from drift from going quiet, from a follow-up that never happened, from a momentum that faded because nobody maintained it. A deal that hasn't had any activity in two weeks is a deal that's cooling, and the longer it stays cool, the harder it becomes to revive. By the time a rep notices that an important deal has gone silent, weeks may have passed and the prospect's attention has moved elsewhere.
This report catches the drift before it becomes terminal. Build it to show all open opportunities where the last activity date is more than 14 days ago, sorted by deal amount so the most valuable neglected deals appear first. Check it at the start of every week. Each deal on the list is a prompt: either re-engage it with a specific, value-adding touch, or make a deliberate decision that it's not worth pursuing and update its stage accordingly. What you should not do is let it sit on the list indefinitely, neither worked nor closed, occupying pipeline space and forecast weight without any real activity behind it.
The discipline this report enforces is the discipline of never letting a deal drift silently. Every open deal either gets active attention or gets an honest status change. That single habit, maintained consistently, prevents the most common and most avoidable category of pipeline loss.
Report 2: Deals Closing This Month, Sorted by Stage
The second essential report is your current-month close list, organized by stage so you can see at a glance whether the deals you're counting on are actually positioned to close when you say they will.
Every AE has a number they're committing to for the month, and that number is built from specific deals expected to close. The danger is the gap between the close date on a deal and the stage the deal is actually in. A deal with a close date of the 28th that's still sitting in an early stage on the 20th is a deal in trouble there simply isn't enough time for it to move through the remaining stages of your sales process before the date you've committed to. But that trouble is invisible unless you're looking at close date and stage together, which is exactly what this report does.
Build it to show all opportunities with a close date in the current month, grouped by stage, with the amount and close date visible for each. The grouping is what makes it powerful: you can immediately see how much of your committed number is sitting in late stages where it's genuinely likely to close, versus how much is stranded in early stages where the close date is more hope than plan. That distinction is the difference between a forecast you can trust and one that's going to disappoint you at month-end.
Checking this report regularly through the month lets you intervene while intervention is still possible. A deal that's behind where it needs to be on the 20th can sometimes be accelerated with a focused effort, an executive touch, a removal of whatever's blocking progress. The same deal discovered to be behind on the 31st is simply a miss. The report buys you the time to act, which is the only thing that converts a troubled deal into a closed one.
Report 3: Pipeline Created This Month
The third report shifts focus from closing to creating. It shows how much new pipeline you've generated this month new opportunities created, with their amounts and sources which is the leading indicator of whether you'll have enough to close in future months.
It's easy for an AE to become so focused on closing this month's deals that they neglect creating the pipeline they'll need to close next month and the month after. This is one of the most common rhythms of failure in quota-carrying sales: a rep has a great month closing, but because they spent all their energy closing and none creating, the following month's pipeline is thin, and they miss. Then they scramble to create pipeline, which closes a month later, creating a feast-and-famine cycle that's exhausting and unpredictable.
The pipeline-created report counteracts this by making pipeline generation visible and therefore manageable. Build it to show all opportunities created in the current month, with amount and source, ideally compared against the amount of new pipeline you know you need to create monthly to sustain your quota. When the report shows you're behind on pipeline creation, that's a signal to redirect effort toward prospecting and opportunity development before the shortfall shows up as a missed quarter two months down the line.
The value of this report is that it makes a lagging problem into a leading one. A pipeline-creation shortfall this month is a closing shortfall in two months, but only the closing shortfall is obvious without the report. By surfacing the pipeline-creation number while it's still actionable, the report lets you fix the problem before it becomes a miss, which is the entire point of tracking leading indicators rather than just lagging ones.
Report 4: Deals That Slipped
The fourth report tracks deals whose close dates have moved opportunities where the expected close date has been pushed from one period to a later one. Slippage is one of the most important and most under-monitored signals in a pipeline, and a report that surfaces it systematically is enormously valuable.
A single date change on a deal might be nothing a minor schedule adjustment, a procurement delay, a reasonable shift. But a pattern of slippage is a serious warning sign. A deal whose close date has been pushed two or three times is usually a deal that isn't really progressing, even if the rep keeps believing it's about to close. Each push is rationalized individually they need another week, the budget got delayed, the champion was traveling but the cumulative pattern reveals a deal that may never close at all, and that's far more honest information than any single optimistic close date.
Build this report to show opportunities where the close date has been changed, particularly those pushed multiple times, with the history of the changes visible. Reviewing it regularly does two things. First, it forces an honest reassessment of deals that keep slipping at some point, repeated slippage should trigger either a real intervention to understand what's actually blocking the deal, or a decision to disqualify it rather than letting it haunt the forecast indefinitely. Second, it improves your forecasting accuracy over time, because you start to recognize the slippage patterns that predict a deal won't close and you stop counting those deals as confidently as you once did.
The deeper value here is that slippage data counteracts the natural optimism that distorts sales forecasting. Reps want to believe their deals will close, and that optimism leads them to keep aggressive close dates on deals that don't deserve them. The slippage report introduces a discipline of honesty: a deal that has slipped three times has earned skepticism, regardless of how the rep feels about it. That skepticism, applied consistently, produces forecasts that are far more reliable than gut feel allows.
Report 5: Won and Lost This Quarter, With Reasons
The fifth report is the one most focused on learning rather than managing: a report of your closed deals this quarter, both won and lost, with the reasons captured for each. This is the report that turns experience into improvement, and it's the one most reps never build because its value is less immediate than the others.
Every closed deal contains a lesson, but the lessons are only useful if you actually look at them in aggregate. A single won deal or lost deal is an anecdote. Twenty won and lost deals, viewed together with their reasons, are a pattern and the pattern tells you things about your own selling that no individual deal can. Maybe you're winning consistently in one industry and losing in another. Maybe a particular competitor keeps beating you, or a particular objection keeps killing your deals. Maybe your win rate is much higher when a certain stakeholder is involved early. These patterns are the raw material of getting better, and they're invisible without a report that aggregates your outcomes.
Build this report to show all opportunities closed in the current quarter, segmented by won and lost, with the closed reason, the amount, the industry, and the competitor (if any) visible for each. Review it at least monthly, and study it seriously at the end of each quarter. The goal is to find the patterns in your own results and adjust your approach accordingly to lean harder into the segments and situations where you win, and to either fix or avoid the ones where you lose.
This report matters because it's the mechanism by which a rep actually improves over time rather than just accumulating experience. Experience without reflection doesn't make you better; it just makes you older. The won-and-lost report forces the reflection, turning the raw experience of your closed deals into specific, actionable knowledge about how to sell more effectively. The reps who study this report are the ones whose win rates climb year over year, while the reps who never look at it keep making the same mistakes without ever recognizing the pattern.
Building the Habit, Not Just the Reports
The five reports are only as valuable as the habit of checking them. A report that exists but never gets looked at is worth nothing, and building these reports is the easy part maintaining the discipline of reviewing them on a regular cadence is what actually produces the results.
A practical rhythm: check the no-activity report and the closing-this-month report at the start of every week, because those drive your daily prioritization and need to be current. Check the pipeline-created and slippage reports weekly as well, to stay ahead of the leading indicators. And study the won-and-lost report monthly, with a deeper review at quarter-end. None of this takes long once the reports are built a focused review of all five takes a fraction of the time that a single lost deal costs but the cumulative effect of operating from this information rather than from a flat opportunity list is the difference between commanding your pipeline and being surprised by it.
The reps who build these reports and check them faithfully aren't smarter or more naturally gifted than their peers. They've simply set themselves up to see what matters, when it matters, in a format that makes the right action obvious. That setup is available to any AE willing to spend an afternoon building the reports and then build the habit of using them. In a profession where the difference between hitting quota and missing it often comes down to a few deals that could have been saved with earlier attention, that habit is one of the highest-return investments a rep can make.
TRY BACKCHANNELS FREE
Your next customers are already in the database.
Backchannels gives you 225,000 verified software decision-makers. Filter to your exact ICP, preview matches for free, and push them straight into Salesforce or HubSpot. Pay per contact. No subscription, no contract.
Browse contacts freeNo credit card. Preview before you spend a credit.
No items found.
Final Thoughts
The reps who command their pipeline aren't smarter they look at the right data at the right cadence. Build these five Salesforce reports, bookmark them, and operate proactively instead of reactively.
Published
August 14, 2026
Writer
Joe Backchannels
Share


Most Wanted


12 min read

12 min read

June 2026